Get this checklist as a beautifully formatted 13-page PDF. Print it, save it, or share it with your team.
"We pinpointed $67,000 in missed billing codes in our first month. The ROI was immediate."

Rob spent years inside large dental service organizations as a systems architect, watching clinics leave millions on the table through preventable revenue leaks. After advising 50+ clinic owners across dental and allied health and participating in multiple M&A processes, he saw the same patterns repeat across physio, chiro, massage, and acupuncture practices. He built Caretrics to automate what clinic owners were doing manually.

Get your personalized Recovery Report in 24 hours and start recovering $4,200+/month.
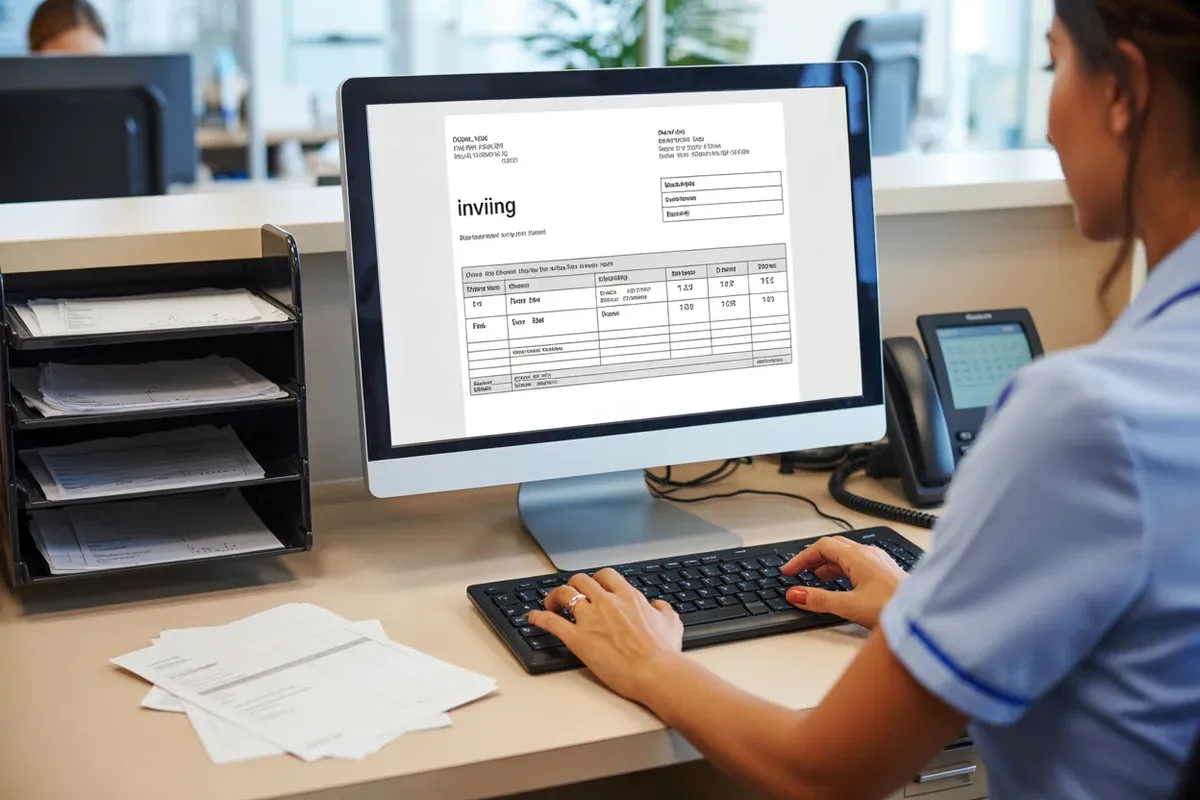
Before you hire a consultant or invest in optimization tools, there's a simple way to uncover hidden revenue in your Jane.app clinic: run a DIY revenue audit using reports you already have.
This 15-minute checklist will help you identify the 4 most common revenue leaks in Jane.app clinics. On average, clinics discover $18,000 to $28,000 per year in recoverable revenue using this exact process.
The best part? You don't need special tools or expertise—just your existing Jane.app reports and 15 minutes of focused time.
This audit works best for:
If you're running a busy clinic but revenue feels flat despite full schedules, this audit will show you exactly where the leaks are.
Based on analysis of 127 Jane.app clinics, these are the most common revenue leaks:
Let's find yours.
Money that's been sitting unpaid for 60+ days. Industry data shows that invoices over 90 days old have only a 23% collection rate—the rest becomes write-offs.
Navigation: Reports > Accounting > AR Aging
🚩 More than 18% of your AR is over 90 days old This means you have a collection velocity problem. Money is aging faster than you're collecting it.
🚩 Total AR > 1.5x your average monthly revenue Example: If you bill $30,000/month but your AR Aging report shows $50,000+ total outstanding, you have a serious collection backlog.
🚩 Growing 120+ day bucket month-over-month If this column keeps growing, you're essentially running a free clinic for patients who don't pay.
Formula: (AR over 60 days) × 0.77 = Money at risk of write-off
Example:
Your AR Leak: $__________
See how much revenue your clinic is leaving on the table
Connect your Jane.app account and get a personalized Recovery Report in 24 hours.
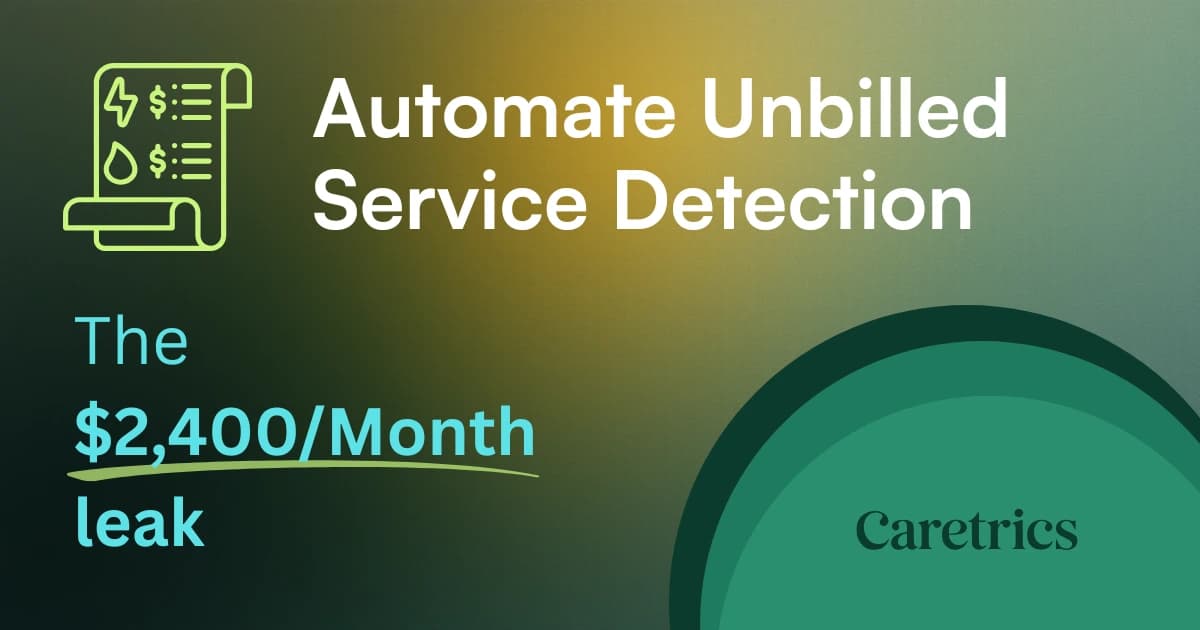
Appointments where the patient showed up and received treatment, but somehow the invoice was never created or completed. This happens most often with:
Navigation: Reports > Appointments > Scoreboard
🚩 More than 10% of "Arrived" appointments have no matching invoice Industry best-practice is <5%. If you're over 10%, you have a systematic billing gap.
🚩 Specific providers with higher unbilled rates Run the Scoreboard report filtered by provider. If Provider A has 23% unbilled but Provider B has only 4%, you've found a training opportunity.
🚩 Same-day multi-provider appointments Look for patients who saw 2+ practitioners in one day (e.g., adjustment + massage). These are 34% more likely to have unbilled services.
Simplified Formula: (Arrived appointments - Invoices) × $95 average = Monthly leak
Example:
Your Unbilled Services Leak: $__________/month
💡 Caretrics Shortcut: Our system automatically cross-references every "Arrived" appointment against invoices daily, flagging unbilled services within 24 hours. Learn how it works →
Empty appointment slots that should've been filled. The average Jane.app clinic has an 11.2% no-show rate. Best-in-class clinics maintain 4-5%. That 6-7% gap represents significant lost revenue.
Navigation: Reports > Appointments > Scoreboard
🚩 No-show rate above 8% You're losing significant revenue to unfilled slots. Industry average is 8-12%, but that doesn't mean it's acceptable.
🚩 No automated reminders enabled Check: Settings > Notifications > Appointment Reminders. If you're not sending SMS reminders 24 hours before + email 48 hours before, you're voluntarily accepting a higher no-show rate.
🚩 No cancellation policy Check: Settings > Policies > Cancellation Policy. Clinics without an enforced policy average 11.2% no-show rate. Clinics with policy average 5.8%.
Formula: (Your rate - Target rate) × Monthly appointments × Average appointment value
Example:
Your No-Show Leak: $__________/month
💡 Quick Fix: Enable SMS reminders in Jane.app today. Most clinics see a 30-40% reduction in no-shows within 2 weeks. SMS cost: ~$0.02/message. No-show cost: $95/appointment. ROI: 4,750%.
Providers with unfilled capacity—scheduled hours that aren't getting booked. This is the most overlooked revenue leak in multi-provider clinics.
Navigation: Reports > Staff > Staff Performance
🚩 Any provider with utilization below 75% This provider has significant unfilled capacity. Either they need more marketing, better scheduling, or their hours should be reduced.
🚩 Wide gaps between providers If Provider A is at 92% utilization and Provider B is at 64%, you have a scheduling problem, not a demand problem.
🚩 Low revenue per hour compared to peers Jane's Staff Performance report shows revenue/hour per provider. If one provider generates $140/hour and another generates $85/hour (same discipline), investigate why.
Formula: (Target utilization - Current utilization) × Scheduled hours × Average revenue/hour
Example:
Your Utilization Gap Leak (sum all providers under 85%): $__________/month
💡 Strategic Fix: Before adding new providers, optimize existing capacity. A single provider going from 65% → 85% utilization can add $5,000/month in revenue with zero additional overhead.
Add up your 4 leaks:
Total Monthly Opportunity: $__________
Total Annual Opportunity: $__________ × 12 = $__________
$12,000 - $24,000/year You're running a relatively tight ship, but there's still low-hanging fruit. Focus on the leak with the highest dollar value first.
$24,000 - $48,000/year This is typical for a clinic with 200-400 monthly appointments. These leaks are systematic—fixing them requires process changes, not just working harder.
$48,000+/year You have major revenue optimization opportunities. This level of leakage suggests gaps in systems, training, or technology. Prioritize the unbilled services and utilization leaks first (highest ROI).
Most clinic owners assume revenue is flat because:
But the data shows something different: Most clinics are underutilizing their existing patient base and schedule. You don't need more patients—you need to capture 100% of the revenue from the patients you already have.
Pros: No cost Cons: Requires ongoing manual effort, easy to fall back into old patterns
Caretrics automatically:
Average time to ROI: 7-14 days Average monthly recovery: $2,400 - $4,800
Get Your Free Money Map → We'll analyze 12 months of your Jane.app data and deliver a personalized report in 24 hours.
Q: Is it normal to have this many revenue leaks? Yes. Based on our analysis of 127 Jane.app clinics, 94% have at least 3 of these 4 leaks. The average total opportunity is $26,400/year. It's not a failure of your team—it's a natural result of manual processes and busy schedules.
Q: Which leak should I fix first? Start with whichever has the highest dollar value and the fastest implementation. Typically this is:
Q: Will these numbers stay fixed once I address them? Not without ongoing monitoring. Most clinics see 30-50% of the leak return within 6 months if they don't maintain new processes. This is why automated monitoring (Caretrics) has higher long-term success rates than DIY fixes.
Q: Can I share this audit with my team? Absolutely. In fact, we recommend running this audit with your front desk and billing staff. They often know where the gaps are but haven't had permission to prioritize fixing them.
You now know:
The question is: What will you do with this information?
Most clinic owners bookmark this checklist and never come back to it. Don't be that person. Pick one leak and commit to fixing it this week.
If you want help implementing fixes across all 4 leaks, we can deliver a detailed Money Map with 90-day action plan in 24 hours.
This checklist is part of Caretrics' Revenue Optimization Library. Get more Jane.app-specific guides, calculators, and case studies at caretrics.com/library.